The following API functions are available:
| Name and Link to API Doc | Code Example |
|---|
| attributedResult | How to display a traffic light image in the Price List column: | Code Block |
|---|
def image = '/images/small_trafficlight_green.png'
return api.attributedResult('').withRawCSS('background:url("'+image+'"); height:20px; width: 53px;') |
|
| buildFlexChart |
|
| criticalAlert |
|
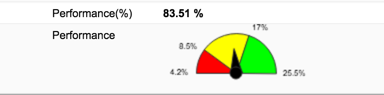
| newGauge | Creates a new gauge object that can be further customized. If the Gauge is returned as the result of an element, it will be rendered on the screen.  See also How to Add a Gauge Chart to Line Detail and Header. See also How to Add a Gauge Chart to Line Detail and Header.
| Code Block |
|---|
| def g = api.newGauge()
g.setMin(5)
g.setMax(95)
g.addSector(20, "#FF0000")
g.addSector(50, "#FFFF00")
g.addSector(null, "#00FF00")
g.setValue(37) |
|
| newMatrix | Creates a matrix (data-table) which can be displayed on a Dashboard, Quote, Price List, ... Given that you have a logic with following logic in element: | Code Block |
|---|
| def resultMatrix = api.newMatrix("Customer Id","Name","Net Margin %")
resultMatrix.addRow([ "Customer Id" : "C1", "Name" : "While Customer", "Net Margin %" : 10.4 ])
resultMatrix.addRow([ "Customer Id" : "C2", "Name" : "Green Customer", "Net Margin %" : 4.4 ])
resultMatrix.addRow([ "Customer Id" : "C3", "Name" : "Blue Customer" , "Net Margin %" : 1.4 ])
return resultMatrix |
When you run the logic in the Price List, then you will see something like this: 
After clicking on the "table" icon you will see this popup window: 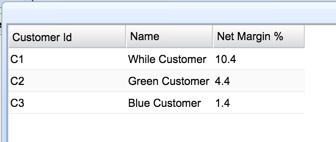 |
| redAlert |
|
| removeManualOverride |
|
| yellowAlert |
|