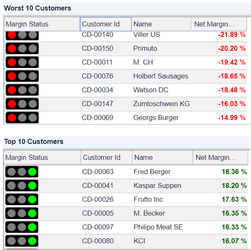
If you need to introduce a quick visual evaluation of your data, such as in a Top/Bottom Performers table, you can make use of the traffic lights (green, yellow, red) in the data tables. In the calculation logic you define the conditions corresponding to each color (see the example below).
The following images are ready to use:
...