/
How to Run a Simulation in Analytics
How to Run a Simulation in Analytics
This section explains how to create simulations in Analytics and how to read and compare the results for different scenarios.
- Create a new simulation by clicking the Add icon. Give it a name and a label.
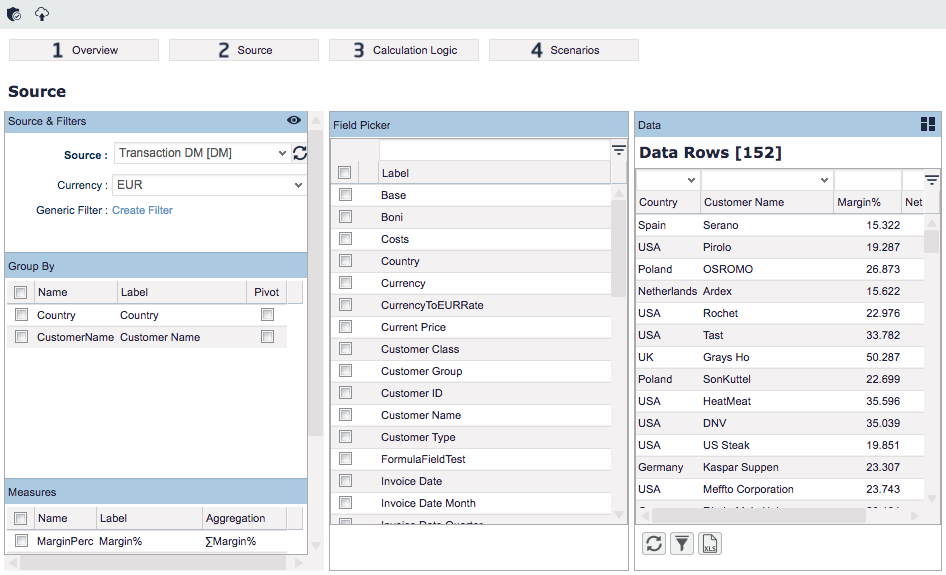
- Go to the Source section and in the Source field, select the Datamart whose data you want to use for the simulation.
- Still in the Source section, create a data query to get the right data set for the simulation. The available options are the same as in Rollups. When you are done and before you continue to the next step, validate and deploy the simulation.
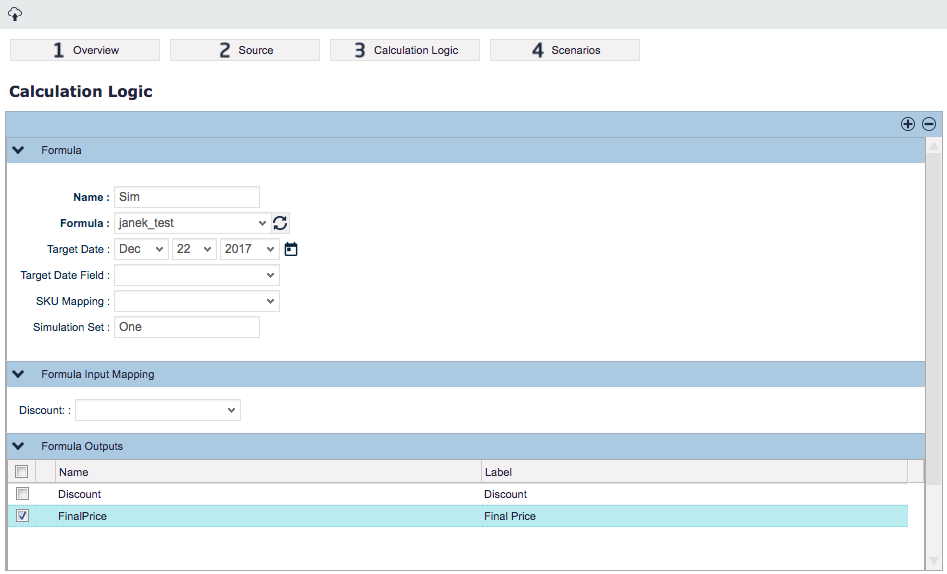
- Continue to the Calculation Logic section and:
- Select the formula that will manipulate the data.
- Set the target date either manually or select a Datamart field containing the target dates.
- (Optional) Map SKU to a Datamart field.
- (Optional) Enter the name of a Simulation Set – a label that determines which pricing parameters will be used by the logic (those with the same simulation set label).
- In Formula Input Mapping, you can map user inputs from the selected calculation logic to the corresponding Datamart fields. You can choose to make no selection – any formula input not mapped here can be set later on the Scenario level.
The idea behind is that in this section you define the inputs that are static for all scenarios and on the Scenario level you set variables by which you compare the scenarios. For example, you can increase 'Cost' by 10 points for each next scenario. - Review the Formula Outputs panel, which lists the calculation logic outputs as defined by its elements. Selected outputs will be added to the result data.
Deploy the simulation before you continue. You can add more calculation logics using the + icon but make sure that the logic names are unique – by default, every added logic will be called 'Sim'.
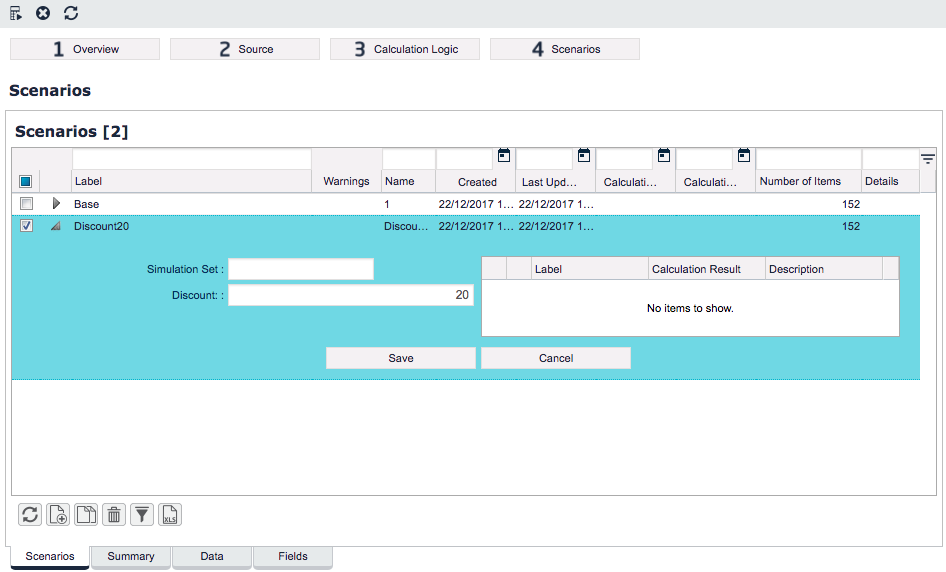
- Go to the Scenarios section and define your scenarios. Each scenario should represent a different version of the simulation.
- (Optional) Enter the name of a Simulation Set, determining which pricing parameters will be used for the scenario.
- Enter the values for all the user inputs that have not been previously mapped. Typically, you will set a different value for each scenario.
- Run the simulation by clicking the Calculate icon.
- Review the results. For each scenario, there is a table with calculation results.
There are also three additional tabs in this section:- Summary – When a simulation is completed, the resulting data can be summarized on various levels in the Summary tab. Here we essentially define Rollups to aggregate the data up to the desired level.
The 'Base' rollup is created automatically by the application, both as a typical 'grand totals' sort of query (calculates the SUM() for each numeric field in the data set) and also as a template for a user-defined rollup.
If averages rather than totals, or any other aggregation function are required, then the 'Base' rollup can be modified by clicking the Toggle button. It is, however, recommended saving the modified query as a new rollup. Similarly, when for example additional group-by's are needed, it is best to pick an existing rollup, add the group-by fields, and save it under a different name (see Rollups for details). - Data – Displays a data table containing the combination of the source rows and row level calculation results. In other words, each row resulting from the source query is enriched with the simulation's selected outputs' calculation. Note that if multiple scenarios are defined, there will be rows for all these scenarios. To inspect just one, you can filter the data set in the usual way.
- Fields – Displays the source fields (from the query definition) and the selected outputs.
- Summary – When a simulation is completed, the resulting data can be summarized on various levels in the Summary tab. Here we essentially define Rollups to aggregate the data up to the desired level.
, multiple selections available,
Found an issue in documentation? Write to us.


