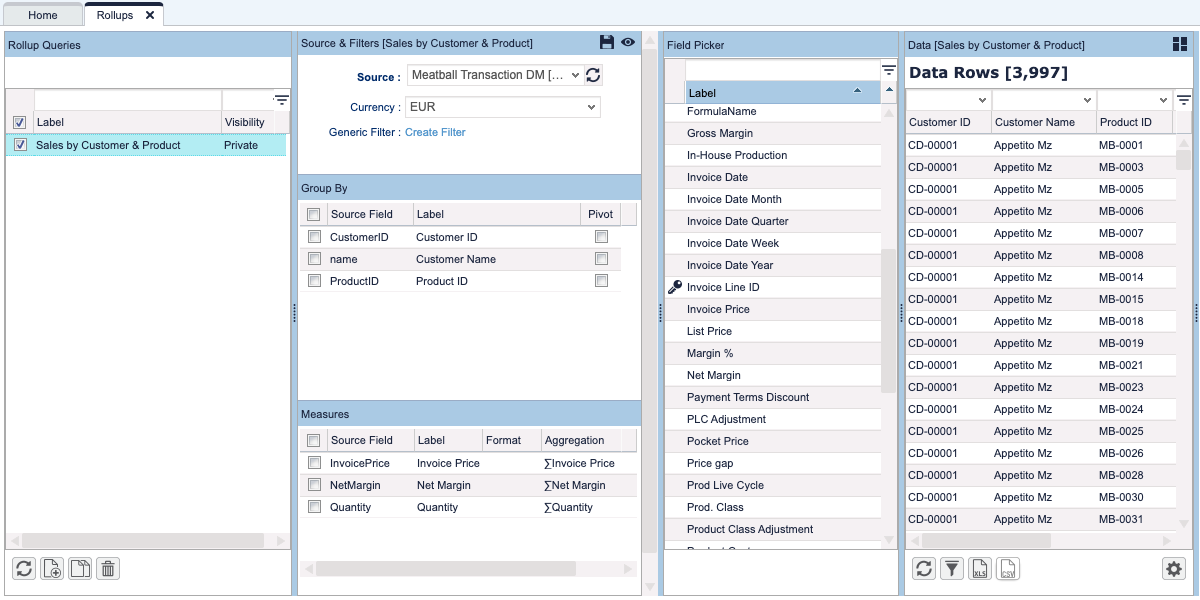
Rollups are persisted Analytics queries aggregating measures along one or more dimensions.

| Table of Contents | ||
|---|---|---|
|
...
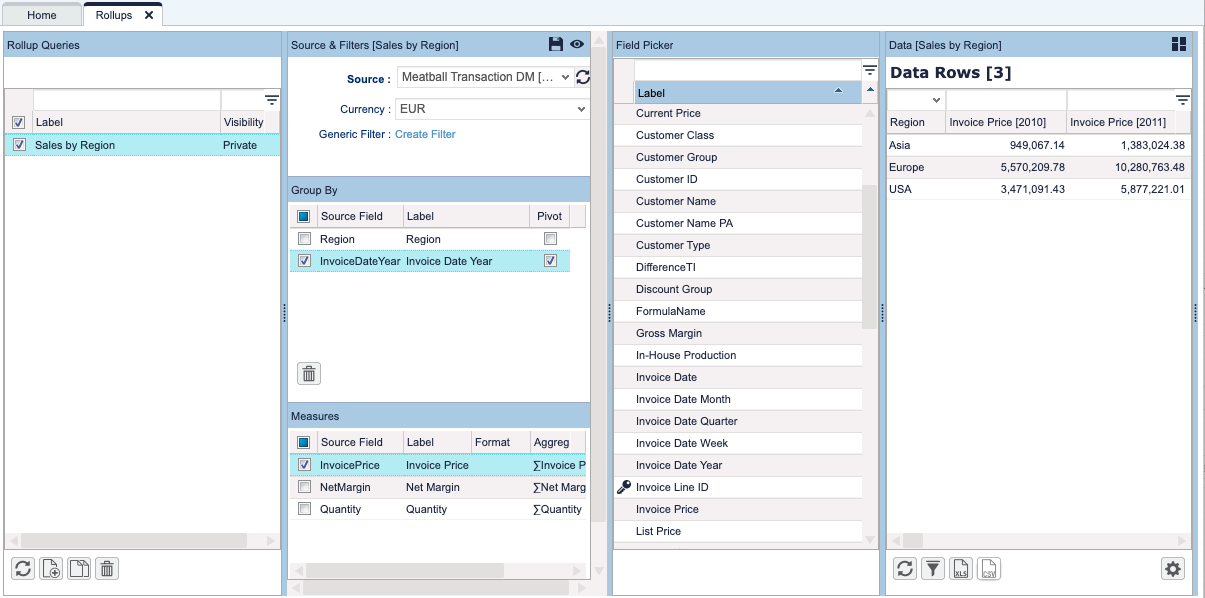
You will often need to compare data for different periods, regions etc. In the following example, we aggregate sales numbers along region and year. By choosing the Invoice Year as the pivot, it is now easier to compare results for subsequent years:

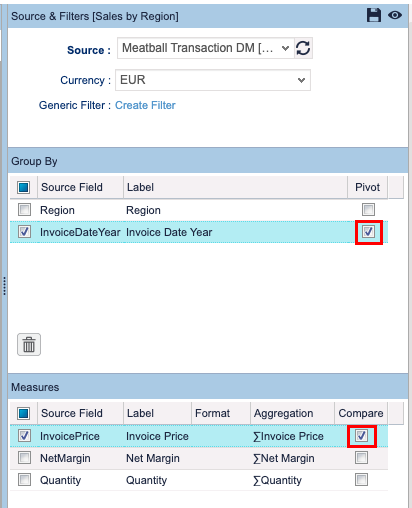
If, in addition, the Compare option is checked against a measure, the query will calculate and return the delta of the aggregated measure between the different periods:

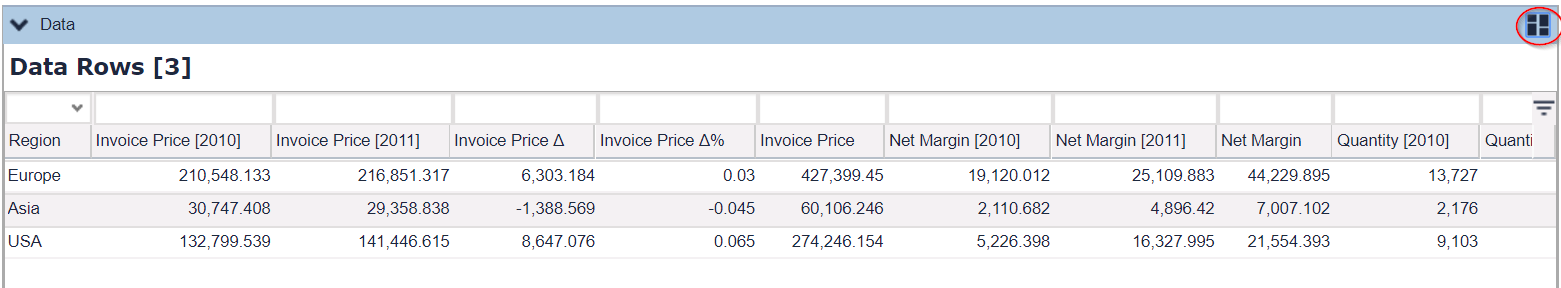

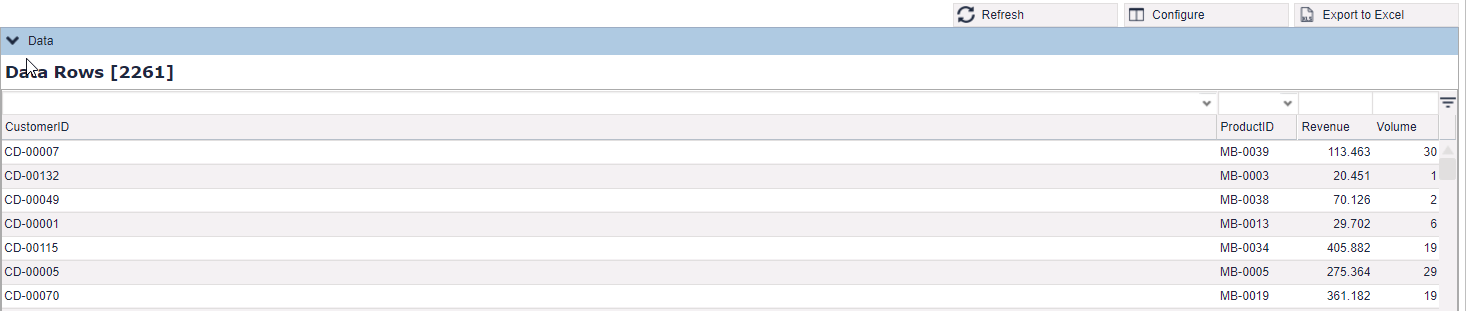
![]() To make more room for the Data panel, the 'Controller' (the two middle panels) can be hidden by clicking the 'Toggle controller' icon at the top right of the Data section.
To make more room for the Data panel, the 'Controller' (the two middle panels) can be hidden by clicking the 'Toggle controller' icon at the top right of the Data section.
...
Here is some sample code:
| paste-code-macro | ||||
|---|---|---|---|---|
| ||||
def dmCtx = api.getDatamartContext()
def dm = dmCtx.getRollup("Rollup_1")
def q = dmCtx.newQuery(dm)
q.select("CustomerID")
q.select("ProductID")
q.select("SUM(InvoicePrice)", "Revenue")
q.select("SUM(Quantity)", "Volume")
api.trace("Query", null, q)
def result = dmCtx.executeQuery(q)
api.trace("Data", null, result?.data)
return dmCtx.buildQuery(q) |
which when used in a Dashboard results in:

Or when used in a CalculationResultGrid or FormulaTestWindow, it is rendered as a clickable 'View' icon:
...