...
| Warning |
|---|
Be aware that the method |
| Table of Contents |
|---|
Column Chart,
...
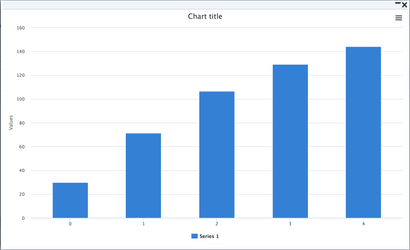
Using Default Template
| Code Block | ||
|---|---|---|
| ||
def data = [
	series: [
    	[
			data: [29.9, 71.5, 106.4, 129.2, 144.0]
		]
    ]
]

api.buildFlexChart(data) |
...
| Code Block | ||||
|---|---|---|---|---|
| ||||
// The default template specifies options which are applied if no explicit template was selected
// Still gets merged with the base template

{
     "chart": {
         "type": "column"
     },
     "tooltip": {
         "formatter": function() {
			return 'The value for <b>'+ this.x +
				'</b> is <b>'+ this.y +'</b>';
		 }
     }
} |
Chart with
...
Full Definition in
...
Template
| Code Block | ||
|---|---|---|
| ||
api.buildFlexChart("FlexChart_tests_T001", "{}") |
...
| Code Block | ||||
|---|---|---|---|---|
| ||||
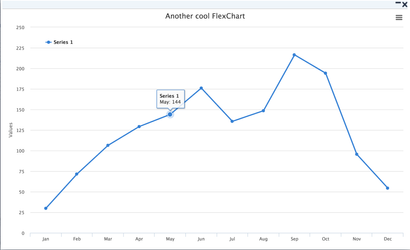
{
        "chart": {
            "type": "line"
        },
        "title": {
            "text": "Another cool FlexChart"
        },
        "xAxis": {
            "categories": ["Jan", "Feb", "Mar", "Apr", "May", "Jun", "Jul", "Aug", "Sep", "Oct", "Nov", "Dec"]
        },
        "yAxis": {
        },
        "legend": {
            "layout": "vertical",
            "floating": true,
            "backgroundColor": "#FFFFFF",
            "align": "left",
            "verticalAlign": "top",
            "y": 60,
            "x": 90
        },
        "tooltip": {
            "formatter": function() {
                return '<b>'+ this.series.name +'</b><br/>'+
                    this.x +': '+ this.y;
            }
        },
        "plotOptions": {
        },
        "series": [{
            "data": [29.9, 71.5, 106.4, 129.2, 144.0, 176.0, 135.6, 148.5, 216.4, 194.1, 95.6, 54.4]
        }]
} |
Line
...
Chart with Definition
...
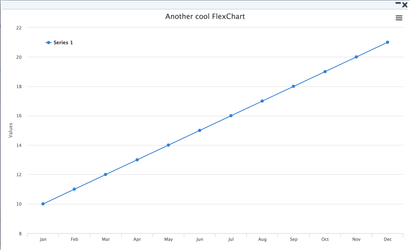
Overriding the Template
| Code Block | ||
|---|---|---|
| ||
def data = [
	series: [
    	[
        	data: [10, 11, 12, 13, 14, 15, 16, 17, 18, 19, 20, 21]
        ]
    ]
]

api.buildFlexChart("FlexChart_tests_T001", data) |
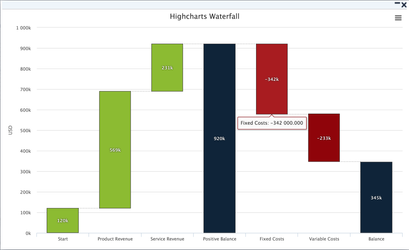
Waterfall
...
Chart
| Code Block | ||
|---|---|---|
| ||
def data = [
        title: [
            text: 'Highcharts Waterfall'
        ],

        yAxis: [
            title: [
                text: 'USD'
            ]
        ],

        series: [[
            data: [[
                name: 'Start',
                y: 120000
            ], [
                name: 'Product Revenue',
                y: 569000
            ], [
                name: 'Service Revenue',
                y: 231000
            ], [
                name: 'Positive Balance',
                isIntermediateSum: true,
                color: "#0d233a"
            ], [
                name: 'Fixed Costs',
                y: -342000
            ], [
                name: 'Variable Costs',
                y: -233000
            ], [
                name: 'Balance',
                isSum: true,
                color: "#0d233a"
            ]]
        ]]
    ]

api.buildFlexChart("hc_wf_base", data) |
...
| Code Block | ||
|---|---|---|
| ||
def fChart = [
        chart: [
            type: 'column'
        ],

        title: [
            text: 'Chart Title'
        ],

		xAxis: [
            categories: ['Apples', 'Oranges', 'Pears', 'Grapes', 'Bananas']
        ],

		series: [[
            name: 'John',
            data: [5, 3, 4, 7, 2]
        ], [
            name: 'Jane',
            data: [2, -2, -3, 2, 1]
        ], [
            name: 'Joe',
            data: [3, 4, 4, -2, 5]
        ]]
    ]

api.buildFlexChart(fChart) |
Column and Spline
...
Chart
| Code Block | ||
|---|---|---|
| ||
if(api.syntaxCheck) return
def customerId = api.getElement("CustomerId")
def customerName = api.getElement("CustomerName")
def specCode = api.getElement("SpecCode")
def specCodeDescription = api.getElement("SpecCodeDescription")
api.buildFlexChart([
chart: [
type: "column"
],
title: [
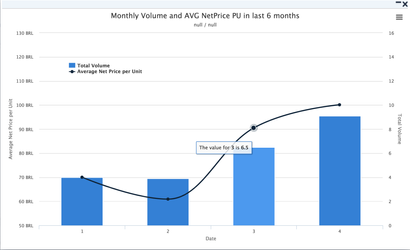
text: "Monthly Volume and AVG NetPrice PU in the last 6 months"
],
subtitle: [
text: customerName + " / " + specCodeDescription
],
xAxis: [
title: [
text: 'Date'
],
categories: ["1", "2", "3", "4"],
//categories: getNetPriceHistory(customerId, specCode)[0]
],
yAxis: [[
title: [
text: 'Average Net Price per Unit'
],
labels: [
format: '{value} BRL'
],
],
[
title: [
text: 'Total Volume'
],
opposite: true
],
],
tooltip: [
shared: true
],
legend: [
layout: 'vertical',
align: 'left',
x: 150,
verticalAlign: 'top',
y: 120,
floating: true
//backgroundColor: (Highcharts.theme && Highcharts.theme.legendBackgroundColor) || '#FFFFFF'
],
series: [
[
name: "Total Volume",
type: 'column',
yAxis: 1,
data: [4.0, 3.9, 6.5, 9.1]
//data: getNetPriceHistory(customerId, specCode)[1]
],
[
name: "Average Net Price per Unit",
type: 'spline',
data: [70.0, 60.9, 90.5, 100.1],
// data: getNetPriceHistory(customerId, specCode)[2],
tooltip: [
valueSuffix: ' BRL'
]
]
]
])
|
Overlapping Area and Column
...
Chart
| Code Block | ||
|---|---|---|
| ||
if (api.isSyntaxCheck()) return
def definition = [
chart: [
type: "area",
//step: 'left'
],
xAxis: [
categories: ['1750', '1800', '1850', '1900', '1950', '1999', '2050'],
],
title: [
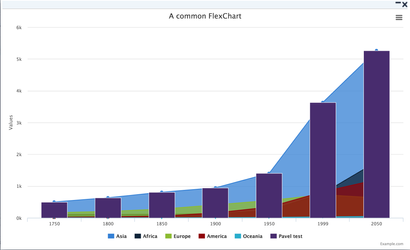
text: "A common FlexChart"
],
series: [
[
name: 'Asia',
type: "area",
data: [502, 635, 809, 947, 1402, 3634, 5268]
], [
name: 'Africa',
type: "area",
data: [106, 107, 111, 133, 221, 767, 1766]
], [
name: 'Europe',
type: "area",
data: [163, 203, 276, 408, 547, 729, 628]
], [
name: 'America',
type: "area",
data: [18, 31, 54, 156, 339, 818, 1201]
], [
name: 'Oceania',
type: "area",
data: [2, 2, 2, 6, 13, 30, 46]
],
[
name: 'Pavel test',
type: "column",
data: [502, 635, 809, 947, 1402, 3634, 5268]
]
]
]
api.buildFlexChart("AreaTemplate", definition) |
...